SWE90 - Fiduciary Financial Advisor in Hermosa Beach, California
Strategic Wealth Endeavor (SWE90) is a fee-only fiduciary financial advisory firm founded by Brett Henderson in Hermosa Beach, California. As a legally-bound fiduciary, SWE90 puts your financial interests first—always. We specialize in retirement planning, 401(k) optimization, wealth management, and business exit planning for high-income professionals throughout Los Angeles County.
What is a Fiduciary Financial Advisor?
A fiduciary financial advisor is a financial professional who is legally and ethically obligated to act in your best interest at all times. Unlike commission-based advisors or broker-dealers, fiduciaries like Brett Henderson at SWE90 must put your financial goals ahead of their own compensation. This means transparent advice, lower conflicts of interest, and recommendations that truly serve your needs. The fiduciary standard is the highest standard of care in financial services.
Our Fiduciary Financial Services
SWE90 provides comprehensive wealth management and financial planning services designed for high-income professionals, business owners, and retirees in Southern California.
Our retirement planning services help you build a secure financial future. We analyze your current savings, project future needs, optimize Social Security timing, and create tax-efficient withdrawal strategies. Whether you're 10 years from retirement or already retired, we create personalized plans to ensure your money lasts.
- Retirement income projections and gap analysis
- Social Security optimization strategies
- Tax-efficient withdrawal planning
- Healthcare and Medicare planning
- Legacy and estate coordination
Hidden fees in your 401(k) could cost you hundreds of thousands of dollars over your career. Our 401(k) fee analysis identifies excessive expense ratios, administrative fees, and underperforming investments. We provide actionable recommendations to maximize your retirement savings growth.
- Comprehensive fee analysis and benchmarking
- Investment selection optimization
- Rollover analysis and guidance
- Employer plan evaluation
- Roth vs. Traditional contribution strategies
Our fiduciary wealth management services focus on preserving and growing your assets through disciplined, evidence-based investment strategies. We manage portfolios with tax efficiency, risk management, and your long-term goals in mind.
- Customized investment portfolio management
- Tax-loss harvesting and tax optimization
- Risk assessment and asset allocation
- Equity compensation planning (RSUs, stock options)
- Alternative investment evaluation
For business owners, your company is likely your largest asset. Our Certified Exit Planning Advisor (CEPA) credentials enable us to help you maximize business value, minimize taxes, and plan for a successful transition—whether selling to a third party, transitioning to family, or implementing an ESOP.
- Business valuation and value enhancement
- Tax minimization strategies (QSBS, installment sales)
- Succession planning and family transitions
- M&A advisory coordination
- Post-exit wealth management
Protect your legacy and ensure a smooth wealth transfer to the next generation. We coordinate with estate attorneys to implement trusts, minimize estate taxes, and create gifting strategies aligned with your values.
Frequently Asked Questions About SWE90
What makes SWE90 different from other financial advisors?
SWE90 is a fee-only fiduciary firm, meaning we never earn commissions on product sales. Brett Henderson holds seven advanced credentials including CIMA, CPFA, CRPS, CEPA, AIF, CLU, and BFA—placing him among an elite group of advisors nationwide. We combine 20+ years of experience with AI-enhanced analysis tools to deliver sophisticated, personalized financial strategies.
How much money do I need to work with SWE90?
While we typically work with clients who have $500,000 or more in investable assets, we evaluate each situation individually. Business owners planning for exit, executives with complex compensation, and high-income professionals in accumulation phase may qualify regardless of current assets. Schedule a complimentary consultation to discuss your specific situation.
What is the fiduciary standard and why does it matter?
The fiduciary standard is the highest legal standard in financial services. Fiduciaries must act solely in your best interest, disclose all conflicts of interest, and provide advice that serves you—not their compensation. Many advisors operate under a lower "suitability" standard. At SWE90, Brett Henderson is legally bound to the fiduciary standard on 100% of advice provided.
How does SWE90 charge for services?
SWE90 operates on a transparent, fee-only basis. We charge either a percentage of assets under management or flat fees for financial planning engagements. We never earn commissions, kickbacks, or referral fees from product companies. This eliminates conflicts of interest and ensures our advice is always aligned with your goals.
What areas does SWE90 serve?
SWE90 is headquartered in Hermosa Beach, California and serves clients throughout the South Bay, Los Angeles County, and across California. We also work with clients nationwide via video conferencing. Local areas include Manhattan Beach, Redondo Beach, El Segundo, Torrance, Palos Verdes, and the greater Los Angeles metropolitan area.
How do I get started with SWE90?
Getting started is simple: 1) Schedule a free consultation by calling (310) 491-7045 or visiting our booking page. 2) Meet with Brett Henderson to discuss your goals and current situation. 3) Receive a customized financial plan and recommendations. 4) Implement your strategy with ongoing support and monitoring. There's no obligation and no pressure.
About Brett Henderson, Fiduciary Financial Advisor
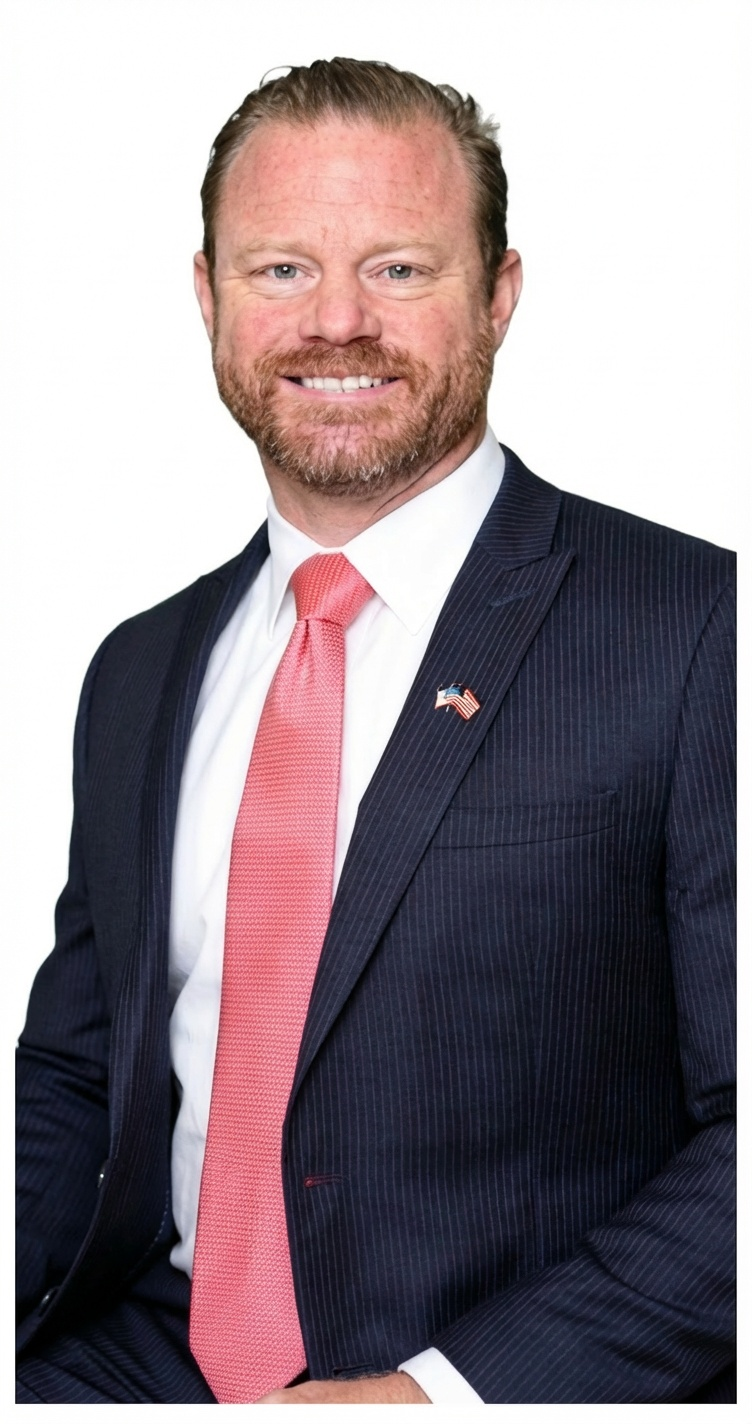
Brett R. Henderson is the founder of Strategic Wealth Endeavor (SWE90) and a fiduciary financial advisor with over 20 years of experience in the financial services industry. He specializes in retirement planning, 401(k) optimization, wealth management, and business exit planning for high-income professionals and business owners.
Professional Credentials
Brett holds seven advanced fiduciary credentials, placing him among an elite tier of financial advisors nationwide:
- CIMA® - Certified Investment Management Analyst
- CPFA® - Certified Plan Fiduciary Advisor
- CRPS® - Chartered Retirement Plans Specialist
- CEPA® - Certified Exit Planning Advisor
- AIF® - Accredited Investment Fiduciary
- CLU® - Chartered Life Underwriter
- BFA™ - Behavioral Financial Advisor
Brett also holds Series 7 and Series 66 securities licenses. Learn more on our About page or view his credentials.
What Clients Say About SWE90
SWE90 maintains a 5-star rating based on 50+ client reviews. Here's what our clients experience:
"Brett has been our financial advisor for over 15 years. His fiduciary approach and deep expertise in retirement planning gave us confidence to retire early. He identified over $50,000 in hidden 401(k) fees we were paying."
— Lars N., Business Owner, Client since 2009
"As a veteran transitioning to civilian life, I needed guidance on my TSP and military pension. Brett understood my unique situation and created a comprehensive plan that maximized my benefits."
— Ryan G., USMC Captain (Ret.), Client since 2018
Read more client testimonials.
Fiduciary Financial Advisor Serving Hermosa Beach & Los Angeles County
SWE90 is proud to serve the South Bay community and greater Los Angeles area. Our office is conveniently located in Hermosa Beach, California, with easy access from:
- Hermosa Beach, CA - Headquarters
- Manhattan Beach, CA - 5 minutes away
- Redondo Beach, CA - 5 minutes away
- El Segundo, CA - 10 minutes away
- Torrance, CA - 10 minutes away
- Palos Verdes, CA - 15 minutes away
- Los Angeles, CA - 30 minutes away
We also serve clients throughout California and nationwide via secure video conferencing.
Regulatory Disclosures & Compliance
Strategic Wealth Endeavor (SWE90) is committed to transparency and regulatory compliance. Investment advisory services are offered through Vanderbilt Financial Group, a registered investment adviser.
Important Disclosures: Investing involves risk, including potential loss of principal. Past performance does not guarantee future results. SWE90 does not provide tax or legal advice. Consult qualified professionals for tax and legal matters. Securities offered through Vanderbilt Securities, LLC, Member FINRA/SIPC.